Features & Benefits
- 4 Analog Channels
- 500 MHz GHz Bandwidth
- MagniVu™ High-speed Acquisition provides 60.6 ps Fine Timing Resolution
- 50 kHz - 6 GHz Frequency Range
- Ultra-wide Capture Bandwidth ≥1 GHz
- 16 Digital Channels
- 1 RF Channel
- Standard Passive Voltage Probes 3.9 pF Capacitive Loading and 500 MHz or 1 GHz Analog Bandwidth
- Time-correlated Analog, Digital, and RF Signal Acquisitions in a Single Instrument
- Wave Inspector®Controls provide Easy Navigation of Time-correlated Data from both the Time and Frequency Domains
- Amplitude, Frequency, and Phase vs. Time Waveforms derived from RF Input
- Selectable Spectrum Time to Discover and Analyze how RF Spectrum Changes over Time – Even on a Stopped Acquisition
- Dedicated Front-panel Controls for Commonly Performed Tasks
- Automated Peak Markers Identify Frequency and Amplitude of Spectrum Peaks
- Manual Markers enable Non-peak Measurements
- Trace Types Include: Normal, Average, Max Hold, and Min Hold
- Detection Types Include: +Peak, –Peak, Average, and Sample
- Spectrogram Display enables Easy Observation and Insight into Slowly Changing RF Phenomena
- Automated Measurements Include: Channel Power, Adjacent Channel Power Ratio (ACPR), and Occupied Bandwidth (OBW)
- Trigger on RF Power Level
- Triggered or Free Run Spectral Analysis
- 10.4 in. (264 mm) Bright XGA Color Display
- Small Footprint and Lightweight – Only 5.8 in. (147 mm) Deep and 11 lb. (5 kg)
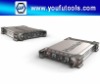
- Two USB 2.0 Host Ports on the Front Panel and Two on the Rear Panel for Quick and Easy Data Storage, Printing, and Connecting a USB Keyboard
- USB 2.0 Device Port on Rear Panel for Easy Connection to a PC or Direct Printing to a PictBridge®-compatible Printer
- Integrated 10/100/1000BASE-T Ethernet Port for Network Connection and Video Out Port to Export the Oscilloscope Display to a Monitor or Projector
- Serial Protocol Trigger, Decode, and Search for I2C, SPI, USB, Ethernet, CAN, LIN, FlexRay, RS-232/422/485/UART, MIL-STD-1553, and I2S/LJ/RJ/TDM
- Advanced RF Triggering
- Power Analysis
- Limit and Mask Testing
- HDTV and Custom Video Analysis
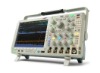
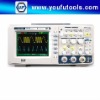
Introducing the Mixed Domain Oscilloscope
Introducing the world’s first and only oscilloscope with a built-in spectrum analyzer. For the first time ever, you can capture time-correlated analog, digital, and RF signals for a complete system view of your device. See both the time and frequency domain in a single glance. View the RF spectrum at any point in time to see how it changes over time or with device state. Solve the most complicated design issues, quickly and efficiently, with an oscilloscope as integrated as your design.
Based on the industry-standard MSO4000B Oscilloscope Series, you can now use your tool of choice, the oscilloscope, to look at the frequency domain rather than having to find and re-learn a spectrum analyzer. However, the power of the MDO goes well beyond simply observing the frequency domain as you would on a spectrum analyzer. The real power is in its ability to correlate events in the frequency domain with the time domain phenomena that caused them.
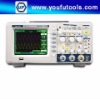
When both the RF channel and any analog or digital channels are on, the oscilloscope display is split into two views. The upper half of the display is a traditional oscilloscope view of the Time Domain. The lower half of the display is a Frequency Domain view of the RF input. Note that the Frequency Domain view is not simply an FFT of the analog or digital channels in the instrument, but is the spectrum acquired from the RF input.
The spectrum shown in the Frequency Domain view is taken from the period of time indicated by the short orange bar in the time domain view – known as the Spectrum Time. With the MDO4000 Series, Spectrum Time can be moved through the acquisition to investigate how the RF spectrum changes over time. And this can be done while the oscilloscope is live and running or on a stopped acquisition.
The time domain graticule on the MDO4000 Series display provides support for three RF time domain traces that are derived from the underlying I and Q data of the RF input including:
- Amplitude – The instantaneous amplitude of the RF input vs. time
- Frequency – The instantaneous frequency of the RF input, relative to the center frequency vs. time
- Phase – The instantaneous phase of the RF input, relative to the center frequency vs. time
Each of these traces may be turned on and off independently, and all three may be displayed simultaneously. RF time domain traces make it easy to understand what’s happening with a time-varying RF signal.
Fast and Accurate Spectral Analysis
When using the RF input by itself, the MDO4000 Series display becomes a full-screen Frequency Domain view. Key spectral parameters such as Center Frequency, Span, Reference Level, and Resolution Bandwidth are all adjusted quickly and easily using the dedicated front-panel menus and keypad.
Intelligent, Efficient Markers
In a traditional spectrum analyzer, it can be a very tedious task to turn on and place enough markers to identify all your peaks of interest. The MDO4000 Series makes this process far more efficient by automatically placing markers on peaks that indicate both the frequency and the amplitude of each peak. The criteria used to determine what a peak is can be adjusted by the user.
The highest amplitude peak is referred to as the reference marker and is shown in red. Marker readouts can be switched between Absolute and Delta readouts. When Delta is selected, marker readouts show each peak’s delta frequency and delta amplitude from the reference marker.
Two manual markers are also available for measuring non-peak portions of the spectrum. When enabled, the reference marker is attached to one of the manual markers, enabling delta measurements from anywhere in the spectrum. In addition to frequency and amplitude, manual marker readouts also include noise density and phase noise readouts depending on whether Absolute or Delta readouts are selected. A “Reference Marker to Center” function instantly moves the frequency indicated by the reference marker to center frequency.
Ultra-wide Capture Bandwidth
Today’s wireless communications vary significantly with time, using sophisticated digital modulation schemes and, often, transmission techniques that involve bursting the output. These modulation schemes can have very wide bandwidth as well. Traditional swept or stepped spectrum analyzers are ill equipped to view these types of signals as they are only able to look at a small portion of the spectrum at any one time.
The amount of spectrum acquired in one acquisition is called the capture bandwidth. Traditional spectrum analyzers sweep or step the capture bandwidth through the desired span to build the requested image. As a result, while the spectrum analyzer is acquiring one portion of the spectrum, the event you care about may be happening in another portion of the spectrum.