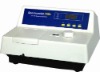
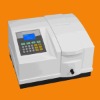
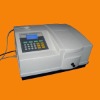
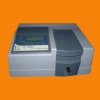
1600G Single Beam VIS Spectrophotometer
1.Wavelength range: 320-1100nm, autoscan
2.Detector: silicon detector for visible regi
Port: Qingdao
Minimum Order Quantity: 1 Set/Sets
Supply Ability: 6000.00 Set/Sets per Year
Payment Terms: T/T
Contact SupplierPackaging Detail: Carton
Delivery Detail: 10 days
1600G Visible Spectrophotometer
All spectrophotometers feature high performance sealed optics mounted on a stable machined platform. The innovative optical layout and state of C-T monochromator with high grade blazed holographic grating ensure accuracy. Its integrated design assures long-term stability and durability. All spectrophotometer are intended to be utilized for research, development, quality control, etc. primarily in the fields of optical materials, semiconductors, new materials, electronics and so on through qualitative and quantitative analyses of samples diverse in kind and size. The comprehensive features, optional sophisticated powerful software, variety of accessories and model configurations will meet or exceed your expectations for performance and value.
1. Features:
a | The spectrophotometers perform built-in wavelength calibration program automatically after energization. Core components will be check during the initialization to ensure the wavelength accuracy and excellent performance |
b | Pre-aligned tungsten lamp for easy lamp replacement. |
c | The innovative optical layout ensures accuracy. Its integrated design assures long-term stability and durability. The precisely aligned detector and quality deuterium and halogen lamps enhance the precision. |
d | Perform basic mode( Abs / %T), quantitative |
e | Pre-set wavelength program (4 wavelengths), and one-touch key response |
f | Single-point curve calibration and multi-point curve calibration (up to 12 points) |
g | Display of fitting degree of curve fitting and concentration data with up to 50 sets of curve parameters storage |
h | Display of concentration data with up to 200 sets of data storage |
i | Dark current calibration / wavelength calibration/System clock management |
j | Backup battery and integrated circuit design controlled by MCU assure non-volatile memory storage |
k | USB data communication |
l | LPT port for printing |
m | 128*64 LCD screen to display all of the parameters |
n | Sealed and solvent-resistant tactile keypad |
2. Technical specifications
Model | 1700PC | 1600G |
Monochromator | C-T type, 1200 L/mm grating | |
Detector | Silicon detector for visible region | |
Display | 128*64 LCD, Blue color | |
Light source | Tungsten lamp(2000h, 20W/12V) | |
Wavelength range | 320-1100 nm, autoscan | |
Wavelength accuracy | ±1.0 nm | |
Wavelength calibration | Automatic at start | |
Wavelength display | 0.1 nm | |
Slit width | 2 nm | 4 nm |
Wavelength repeatability | 0.5 nm | |
Measurement range | -1.0 ~ 200.0%T, -0.5 ~ 3.000Abs, 0 ~ 9999 C, 0 ~ 9999 F | |
Photometric accuracy | ±0.002 Abs (0 to 0.5Abs), ±0.004 Abs (0.5 to 1.0 Abs) | ±0.5 %T (0 – 100%T) |
Photometric repeatability | ±0.001 Abs (0 to 0.5Abs), ±0.002 Abs (0.5 to 1.0 Abs) | ±0.2 %T |
Stray light | 0.2 %T (at 360 nm) | 0.3 %T (at 360 nm) |
Baseline flatness | ≤±0.004 Abs | / |
Stability | ≤0.002 Abs / h (at 500 nm, after 2 hours energization) | / |
Data output | Digital, USB port, LPT parallel | |
Spectrum Software | Spectrum software, Windows® - based | / |
Power | 220V 10% 50Hz 60VA / 110V 10% 60Hz 60VA | |
Standard sample holder | 4-position sample holder | |
Actual dimensions | 456 W X 375 D X 220 H mm, (18.0 W x 14.8 D x 8.7 H in) | |
Net weight | 13.0 Kg (28.5 lbs) | |
Shipping dimensions | 18.5 Kg (40.5 lbs) |
4. Features for spectrum software (Optional):
Basic Mode | Multi-Wavelength | |
Absorbance, %T or Concentration measurements. | Up to 15 wavelengths can be selected and multiple samples can be measured. (Auto cell changer is required to run multiple samples automatically). | |
Quantitative (Standard Curve) Use up to 12 standards to establish standard curve. Four methods for fitting a curve: a. Linear fit b. Linear through zero c. Square fit d. Segmented | Wavelength Scanning Interval: 0.1, 0.2, 0.5, 1, 2, 5 nm Automatically record peaks and valleys. Post-run manipulation and processing includes: a. Re-scaling axes, curve b. Smoothing, combination, zooming, overlap… c. 1st to 3rd derivative |